Exporting SNMP messages to Prometheus and Grafana!
I recently wanted to learn more about the SNMP (simple network management protocol). This protocol has been around for decades and is widely supported throughout the industry. For that reason it’s a useful protocol to consider when you want to monitor hardware in your network.
For testing purposes I decided to monitor my raspberry pi 5. Luckily linux and the pi have a ready made snmp agent (the client that gathers the snmp data) to go. All that’s needed is to install it on the system you want to monitor:
sudo apt update
sudo apt -y  install snmpd snmp
sudo vi /etc/snmp/snmpd.conf
sudo systemctl restart snmpd
snmpget -c public -v2c localhost 1.3.6.1.2.1.1.1.0
The last command above just checks that the snmp agent is working and gathering the system data correctly
Ok great, the next thing I want to do is translate this gathered data into a format that prometheus understands. For this we’ll install the snmp-exporter from prometheus:
 wget https://github.com/prometheus/snmp_exporter/releases/download/v0.26.0/snmp_exporter-0.26.0.linux-arm64.tar.gz
 tar xzf snmp_exporter-0.26.0.linux-arm64.tar.gz
 cd snmp_exporter-0.26.0.linux-arm64/
 cp ./snmp_exporter /usr/local/bin/snmp_exporter
 cp ./snmp.yml /usr/local/bin/snmp.yml
 cd /usr/local/bin/
 sudo useradd --system prometheus
Once installed we want to integrate it as a service on the pi so that it will automatically start if the system is rebooted:
sudo nano /etc/systemd/system/snmp-exporter.service
and paste:
[Unit]
Description=Prometheus SNMP Exporter Service
After=network.target

[Service]
Type=simple
User=prometheus
ExecStart=/usr/local/bin/snmp_exporter --config.file="/usr/local/bin/snmp.yml"

[Install]
WantedBy=multi-user.target
Now start the service:
sudo systemctl daemon-reload
sudo service snmp-exporter start
sudo service snmp-exporter status
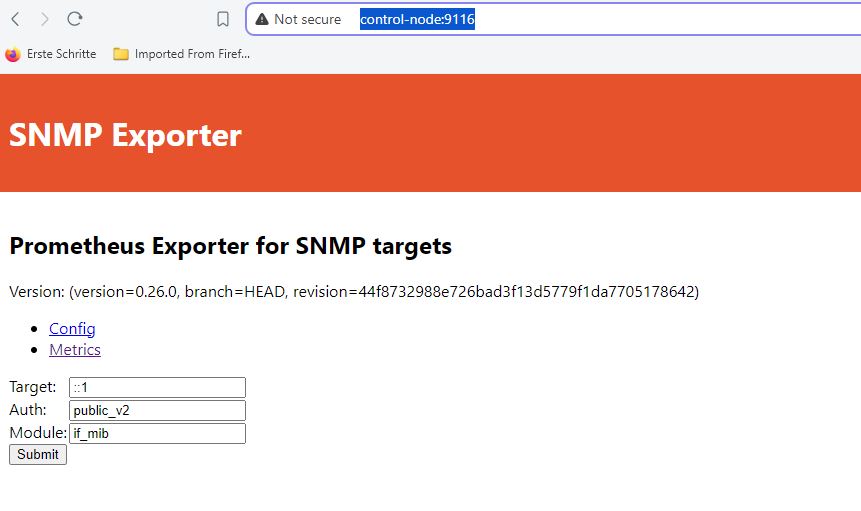
If all went well the snmp-exporter will be outputting the converted data to port 9116.
We can test this by opening a browser and navigating to:

Now we want to setup prometheus and grafana. Prometheus will collect the data from the snmp-exporter and grafana will allow us to display the data in a nicely presented dashboard.
For this I reused this github repo and customized some entries so to use my host names and exporter. This repository was very helpful as it already had some preprovisioned grafana dashboards that I could use right away. My docker compose file looks like this:
version: "3"

networks:
  public: {}

volumes:
  grafana_data: {}
  prometheus_data: {}

services:
  prometheus:
    image: prom/prometheus
    ports:
      - 9990:9090
    networks:
      - public
    volumes:
      - prometheus_data:/prometheus
      - ./prometheus/:/etc/prometheus/
    command:
      - '--config.file=/etc/prometheus/prometheus.yml'
    depends_on:
      - snmp-exporter

  snmp-exporter:
    image: prom/snmp-exporter
    volumes:
      - ./snmp_generator/snmp.yml:/etc/snmp_exporter/snmp.yml
    networks:
      - public

  grafana:
    image: grafana/grafana
    ports:
      - "3110:3000"
    networks:
      - public
    volumes:
      - grafana_data:/var/lib/grafana
      - ./grafana/provisioning/:/etc/grafana/provisioning/
    depends_on:
      - prometheus
    environment:
      GF_SECURITY_ADMIN_PASSWORD: ${GF_SECURITY_ADMIN_PASSWORD}
      GF_USERS_ALLOW_SIGN_UP: "false"
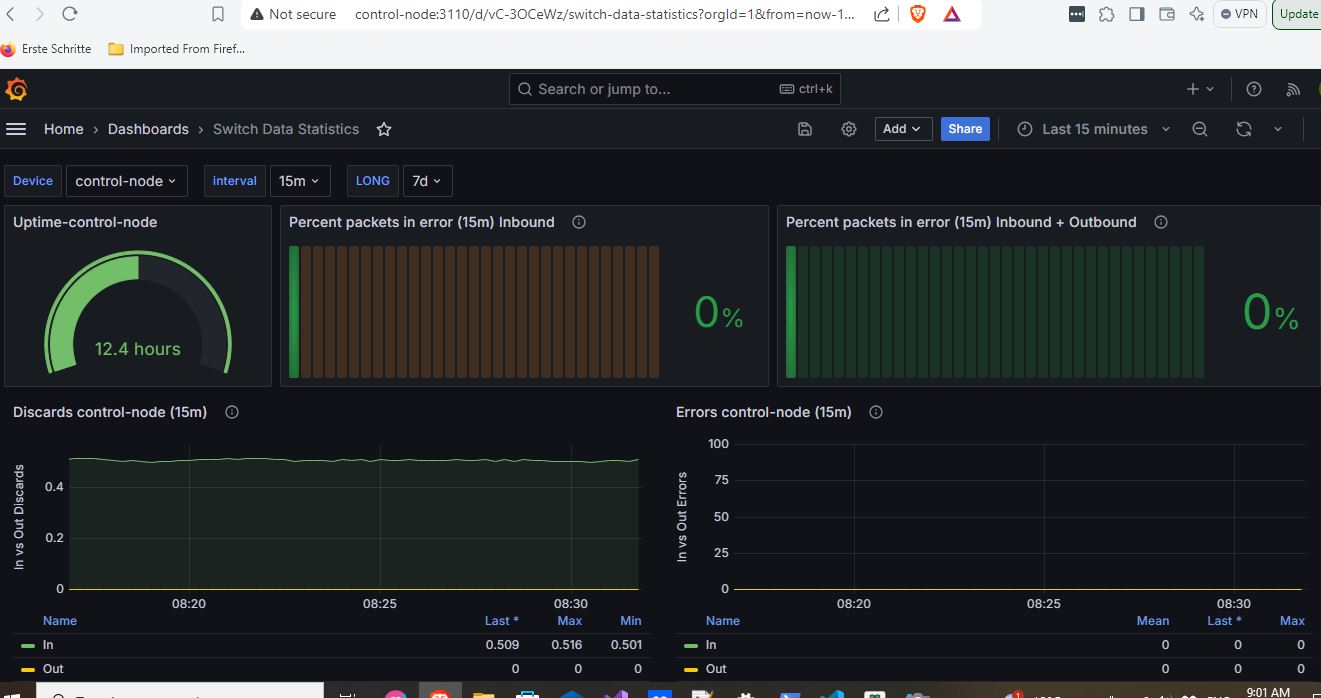
Once I had everything working (which took a little while) I had a working monitoring system that I could use to monitor some stats on my pi:
And that’s it. Further improvements to this system could include:
- An authorization system to limit the amount access to the grafana dashboards.
- A method to deploy the snmp and snmp-exporter services on multiple hardware devices without needing to do this by hand (Ansible or Terraform could be used for this)
- More complex dashboards to display more data about this system.

